Spend Analysis report reference
Understand the data and metrics used in the Spend Analysis report and how to interpret them
Codat's Spend Analysis report is a detailed Excel file generated from your customer's financial data. It is generated automatically after your customer's first data syncSync The process of fetching the latest data from a connected data source. Syncs can be triggered manually or run automatically on a schedule. when they connect their ERP or accounting software, or share their spend file.
Source data
The report provides a structured breakdown of your customer's overall spend, payment methods, and supplier-level activity. This gives you the insights you need to identify card conversion opportunities, run supplier outreach campaigns, and monitor spend on an ongoing basis. It uses the following financial data to surface these insights:
- Bills — the full list of documents issued by your customer's suppliers as requests for payments
- Payments — the full list of payments made by your customer against those bills
- Expenses — the full list of spend transactions not associated with bills (e.g. online purchases, debit card payments)
- Suppliers — the full list of persons and companies that provide goods and services to your customer and their master data (names, contacts, addresses)
- Accounts and payment methods — the full details of how payments were made and what general ledger accounts have been used
If your customer shares data via Data streaming, you can refresh the report at any time. For instructions on downloading the report, see Download reports.
If your customer's data contains transactions in multiple currencies, all amounts in the report are converted to their base currency using the exchange rate recorded at the time of each transaction.
Report structure
The report contains the following tabs:
| Tab | Contents |
|---|---|
| Customer | CompanyCompany In Codat, a company represents your customer's business entity. Companies can have multiple connections to different data sources. details and report parameters |
| Entity Spend Breakdown | Spend summary per entity for multi-entity customers |
| Spend Analysis | Spend breakdown by payment method |
| Supplier Analysis | Spend breakdown by supplier |
| Bills | Source bill records used to generate the report |
| Bill Payments | Source payment records used to generate the report |
| Expenses | Source expense records used to generate the report |
Customer tab
The Customer tab provides an at-a-glance view of the companyCompany In Codat, a company represents your customer's business entity. Companies can have multiple connections to different data sources. you're reviewing, including their administrative details, and the parameters of the generated report.
This tab includes:
| Detail | Description | What it tells you |
|---|---|---|
| CompanyCompany In Codat, a company represents your customer's business entity. Companies can have multiple connections to different data sources. name, Registration #, Tax #, Phone, Addresses, Web linksLink The authorization flow that allows end users to connect their accounting, banking, or commerce platforms to your application via Codat. | Administrative details of the customer entity. | Use to identify and verify the customer for compliance purposes. |
| Start date, End date, Months reviewed | The date range covered by the report. | Source data used in the report is selected based on these dates. Codat sets these values based on your organization's requirements. |
| Excludes suppliers with annual spend below | The minimum supplier spend threshold; applies to the Supplier Analysis tab only. | The Supplier Analysis tab omits suppliers below this threshold. Codat sets these values based on your organization's requirements. |
| Suppliers count, # of bills, Bills amount, # of payments, Payments amount, # of Expenses, Expenses amount | High-level volume and value totals across all suppliers in the report. | Use these summary values for quick checks on data quality, calculating your own metrics, or initial conversations with your customers. |
Entity Spend Breakdown tab
The Entity Spend Breakdown tab is only present in reports for customers with a multi-entity organizational structure. It provides a summary of spend per child entity, enabling you to quickly compare supplier activity across subsidiaries or business units. Use this tab to:
- Identify high and low spend entities to prioritize targeted campaigns.
- Understand how spend is distributed across the group and support consolidated reporting.
- Review entity-level totals to estimate the card conversion opportunity per subsidiary.
| Column | Description | What it tells you |
|---|---|---|
| CompanyCompany In Codat, a company represents your customer's business entity. Companies can have multiple connections to different data sources. ID | The unique Codat identifier for the child entity. | Use to linkLink The authorization flow that allows end users to connect their accounting, banking, or commerce platforms to your application via Codat. this row back to the corresponding entity in the Codat Portal. |
| CompanyCompany In Codat, a company represents your customer's business entity. Companies can have multiple connections to different data sources. name | The name of the child entity as recorded in Codat. | Use to identify which part of the customer's business this row represents. |
| Bills amount | Total value of all bills for this entity within the reporting period. | Use to compare billed spend across entities and identify which parts of the business drive the most supplier activity. |
| Expenses amount | Total value of all expenses for this entity within the reporting period. | Use to identify entities with significant expenses that may be eligible for card conversion. |
| Total spend | Combined bills and expenses amount for this entity. | The key figure for comparing overall spend across entities that helps prioritize which entities to focus card enablement efforts on. |
Spend Analysis tab
The Spend Analysis tab breaks down your customer's spend by inferred payment method (see Payment method determination) and looks at the quantities and amounts of suppliers, bills, payments, and expenses associated with these payment methods.
Each row in the tab represents a payment method (Credit Card, Debit Card, Bank Transfer, Cash, Check, Unknown, or Other) grouped into three categories: Card, Non-Card, and Unknown. Use this tab to:
- Size the card conversion opportunity. Spend on non-card methods represents the opportunity size for virtual card migration.
- Identify payment patterns at a glance. Methods like check often have longer settlement times and higher processing costs, and you can easily spot their prevalence.
- Benchmark payment behavior. Compare the distribution across payment methods over time to track the impact of card enablement efforts.
The Spend Analysis tab aggregates bills, payments, and expenses across all suppliers in the reporting period. The Excludes suppliers with annual spend below threshold on the Customer tab applies only to the Supplier Analysis tab. When that threshold is above zero, the Spend Analysis Overall totals exceed the sum of the Supplier Analysis supplier rows.
Definitions
| Column | Description | What it tells you |
|---|---|---|
| Payment method | The inferred payment method grouping this row (e.g. Credit Card, Check, Bank Transfer). | Use to identify which payment methods are most prevalent in your customer's supplier spend and where the card conversion opportunity lies. |
| # of suppliers | Count of suppliers whose most common payment method is this type. | Compare across rows to understand how supplier relationships are distributed by payment method. |
| % of all suppliers | Share of total suppliers using this payment method. | Use alongside # of suppliers because percentage alone can be misleading with small supplier numbers. |
| % of all bills (by #) | Share of total bill count attributed to this payment method. | Compare with % of all bills (by amount). A significant difference means this method handles many small transactions or a few large ones. |
| % of all bills (by amount) | Share of total bill value attributed to this payment method. | The primary measure of spend share by payment method. Use to quantify how much of total supplier spend is on non-card methods. |
| Total spend | Combined bills and expenses amount for this payment method. | Compare Card with Non-Card rows to quantify the total card migration opportunity, including spend not captured as bills. |
| # of bills | Count of all bills in this payment method group within the reporting period. | A high count with low total spend may indicate many small transactions and could be good candidates for card consolidation. |
| # of bills outstanding | Count of unpaid bills in this group. | Use with Bills outstanding amount and % bills outstanding to assess unpaid supplier exposure by payment method. |
| Bills amount | Total value of all bills in this group. | The base figure for outstanding and late payment percentage calculations in this row. |
| Bills outstanding amount | Total value of unpaid bills in this group. | Quantifies supplier exposure by payment method. For example, high outstanding amounts on non-card methods may indicate cash flow or process issues. |
| % bills outstanding (by amount) | Outstanding bill value as a percentage of total bill value for this group. | Use with # of bills outstanding, Average payment terms, and Average settlement period to understand why bills are outstanding. |
| # of bills paid late | Count of bills in this group paid after their due date. | Indicates payment reliability by method. High late counts on check or bank transfer act as a strong argument for card migration. |
| Bills paid late amount | Total value of bills in this group paid after their due date. | Use with % bills paid late to assess whether lateness is concentrated in high or low-value bills. |
| % bills paid late (by amount) | Late bill value as a percentage of total bill value for this group. | Compare with Average payment terms and Average settlement period. If settlement period consistently exceeds terms, this percentage will be high. Together these three columns build the case for card programs that extend effective payment terms. |
| # of payments | Count of payment transactions across all suppliers in this group. | Use to understand transaction volume by payment method. |
| Payments amount | Total value of all payments made in this group. | Cross-reference with Bills amount to check alignment across the reporting period. |
| Average payment amount | Total payments value divided by number of payments in this group. | Smaller average payments are typically better virtual card candidates than large single payments. |
| Average payment terms | The average number of days between bill issue date and bill due date across all bills in this group. Calculated across all bills and weighted so that higher-value bills have more influence on the result. | Compare with Average settlement period. Terms greater than settlement means the customer repays early, and settlement greater than terms means customer repays late. |
| Average settlement period | The average number of days between bill issue date and actual payment date across all bills in this group. Calculated across all bills and weighted so that higher-value bills have more influence on the result. | Compare directly with Average payment terms to identify which payment methods have the worst payment timing. |
| % of all Expenses (by #) | Share of total expense transaction count attributed to this payment method. | Shows whether expense transactions are concentrated in particular payment methods. |
| % of all Expenses (by amount) | Share of total expense value attributed to this payment method. | Use to identify payment methods where significant spend is occurring outside of Accounts Payable. |
| # of Expenses | Count of expense transactions in this group. | High expense counts on non-card methods indicate ad hoc spend that isn't reflected in Accounts Payable. |
| Expenses amount | Total value of expenses in this group. | Compare with bills amount to understand the full spend picture for this payment method, including spend that isn't reflected in Accounts Payable. |
Supplier Analysis tab
The Supplier Analysis tab contains one row per supplier. It is divided into color-coded sections covering supplier details, bills, payments, terms, and expenses.
Suppliers
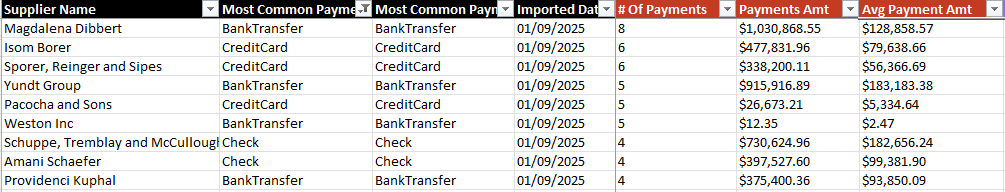
This section covers the supplier's name, the most common method used to pay them, and their imported date. It's foundational for supplier-level analytics and campaign targeting.
- Definitions
- Recommended use
- Example data
| Column | Description | What it tells you |
|---|---|---|
| Supplier name | The supplier's name as recorded in the customer's accounting system. | Naming variations across suppliers may reflect data quality issues that you can choose to flag to your customer. |
| Most common payment method (ERP) | The most frequent payment method as recorded in the ERP's payment method field. Only includes transactions where this field is populated. Frequency is determined by highest count, then by highest amount. If no payments are recorded or all transactions lack a recorded payment method, the value is set to Unknown. | Shows how the customer's own accounting system classifies payments. Use this column to identify suppliers not yet using card. If the value is blank or inconsistent, the Most common payment method (Inferred) column provides a fuller picture. |
| Most common payment method (Inferred) | The most frequent payment method used to pay this supplier, as determined by Codat across all transactions. If it's not possible to infer the payment method, the value is set to Unknown. See Payment method determination. Frequency is determined by highest count, then by highest amount. | The most complete view of how a supplier is paid, including transactions where the payment method field isn't populated in the ERP. Use this to identify non-card suppliers nand prioritize them for targeted outreach. |
| Has Accepted Credit Card (Last 12 months) | A Yes/No flag that indicates whether this supplier has accepted at least one credit card payment in the last 12 months. | Indicates credit card acceptance even when card isn't the most common payment method for this supplier. |
| Imported date | The date this supplier first appeared in the Spend Analysis file. | Helps spot newly added suppliers and track supplier churn. Filter by this date when comparing reports over time to focus on what's changed. |
- New supplier discovery: use the imported date to identify recently added suppliers and track churn.
- Card eligibility: payment method columns show which suppliers are not yet using card.
- Targeted outreach: filter by payment method or imported date to build shortlists for card enablement campaigns.
- Risk monitoring: a sudden spike in new suppliers may indicate fraud or policy breaches worth investigating.

In the above example, the supplier Adams - Hettinger is most commonly paid by a bank transfer and first appeared in the file on March 02, 2026.
If you download a spend analysis file a month later, you will be able to identify new suppliers by using the imported date.
Total spend
Total spend gives you a single figure that represents the full extent of your customer's financial relationship with their suppliers.
| Column | Description | What it tells you |
|---|---|---|
| Total spend | The total of bill amounts and expense amounts for the supplier in base currency. | The key figure for ranking suppliers by size. Start with the highest total spend suppliers for the greatest card enablement impact. |
Bills
This section covers the requests for payment raised by the supplier to your customer, highlighting the amounts and quantities still outstanding.
- Definitions
- Recommended use
- Example data
| Column | Description | What it tells you |
|---|---|---|
| # of bills | Count of all bills raised by a supplier in the reporting period, excluding voided or cancelled records. | Reflects the transaction frequency with the supplier. A high bill count with a low total amount may indicate many small purchases and benefit from card consolidation. |
| # of bills outstanding | The number of bills that have not yet been paid where the amount due is greater than zero. | A high number of outstanding bills in relation to total bill count may indicate cash flow constraints or delays in the payment processes. |
| Bills amount | The total value of all bills raised by a specific supplier listed in base currency. | The primary measure of spend with a supplier. Higher spend may mean greater cashback potential. Use it to rank suppliers for card enablement. |
| Bills outstanding amount | The total value of of remaining due amount across all unpaid bills in base currency. | Helps you understand how much your customer currently owes their suppliers. High outstanding amounts in relation to total spend may indicate payment delays worth exploring. |
| % of bills outstanding (by amount) | The outstanding bills amount represented as a percentage of the total billed amount. | Acts as a metric of payment completion. A high percentage suggests a backlog of unpaid bills, which may be useful when discussing working capital and payment terms. |
| # of bills paid late | The number of bills from a supplier where the actual payment date is after the bill due date. | Frequent late payments suggest process inefficiency, cash flow constrains, or issues in the supplier relationship. Use this as an opportunity to introduce card payments for more predictable bill settlement. |
| Bills paid late amount | The total of bill amounts in base currency where payment date is later than due date. | Large amounts may signal significant exposure to late fees, damaged supplier trust, or operational bottlenecks. |
| % bills paid late (by amount) | The value of bills paid late represented as a percentage of total billed amount. | Demonstrates late payment exposure regardless of the absolute spend with a supplier. High percentages point to suppliers most affected by late payments. |
| Most recent bill | The latest bill issue date for a supplier in the reporting period. | A very old bill date may indicate the supplier is no longer used, and should be excluded from card outreach. |
- Churn risk: flag suppliers where late payments may signal a poor working relationship or trigger contract renegotiations.
- Process gaps: high late payment rates point to suppliers where automation or card payments could improve reliability.
- Cash flow visibility: outstanding bill data quantifies payment delays, supporting working capital forecasting.
- Supplier exposure: outstanding balances per supplier provide input to credit risk and underwriting assessments.
- Anomaly detection: sudden increases in outstanding bills or new suppliers may indicate fraud or process issues.


Let's look at the third row in the above example that relates to the Fay - West supplier. This supplier has raised a total of 3 bills, 1 of which is not yet paid. The total amount of these 3 bills comes to $32,730.83, with the majority of that total ($32,607.83) still requiring payment. In percentage terms, an incredible 99.6% of the total amount still needs to be paid to the supplier. Fay - West raised their most recent bill on August 1, 2024.
This likely indicates a poor working relationship with the supplier and may have resulted in litigation, debt collections, or issues with supply. While it may not be possible to repair trust with this supplier, these records act as evidence that the customer's bill settlement process will benefit from card payments.
Payments
This section goes into the details of payments your customer has made to their suppliers.
- Definitions
- Recommended use
- Example data
| Column | Description | What it tells you |
|---|---|---|
| # of payments | Count of all payment records linked to the supplier's bills in the reporting period. | Compare with the total of bills to understand payment patterns. For example, a much higher payment count than bill count may indicate partial payments or split settlements. |
| Payments amount | The total value of all payments made to the supplier in base currency. | Cross-reference with Bills amount. A significant gap between the Bills amount and Payments amount may indicate outstanding balances or timing differences across the reporting period. |
| Average payment amount | The average size of individual payments to the supplier, calculated as the total value of payments divided by the number of payments. | Large average payments may indicate a strategic supplier worth prioritizing for card enablement. Small payments may indicate low-value transactional spend. |
- Payment discipline: high payment counts when compared to bill counts may indicate process inefficiencies.
- Supplier prioritisation: frequent or high-value payments identify strategic suppliers worth targeting for card enablement.
- Cash flow management: average payment size helps size the opportunity for card migration.
- Spend migration: suppliers with high payment volume but no card usage are prime candidates for card enablement.
Having a look at suppliers with a higher number of payments, we can see that their average payment amounts are moderately high. This may indicate strategic suppliers and may be worth prioritizing for card enablement.
Payment terms
This section compares the agreed payment terms with the actual time taken to settle bills. It contains three related columns that are designed to be used together.
- Definitions
- Recommended use
- Example data
| Column | Description | What it tells you |
|---|---|---|
| Average payment terms | The average contractual payment window for the supplier, calculated across all bills and weighted so that higher-value bills have more influence on the result. | It's the most robust measure for contractual terms and should be used for weighted analysis. |
| Common payment terms days | The most frequently occurring payment term in days for the supplier. Where multiple payment terms are common, frequency is by highest associated bill amount, then by lowest term days. | Use as a quick reference for the standard contractual term most commonly seen on bills from this supplier. |
| Average settlement period | The average number of days between bill issue date and payment date, calculated across all bills and weighted so that higher-value bills have more influence on the result. | Compare directly with average payment terms to see if your customer is paying early, on time, or late. |
-
Use Common payment terms as a quick reference for the standard term on the supplier's bills. For detailed analysis, average payment terms is more useful as it is weighted and accounts for all bills.
-
Compare Average payment terms with Average settlement period to assess whether your customer is paying their supplier early, on time, or late. If the average settlement period is greater than the average payment terms, payments are typically late.
Consistent early or late payments present an opportunity to renegotiate discounts or reset payment timing. See the following examples:
Example 1Average payment terms - 30 days, average settlement period - 54 days.
The customer is paying their supplier 14 days late on average. Moving the payments to this supplier to a virtual card program could provide the supplier with more predictable cash flow, and allow the customer to earn card rebates on the spend.
Example 2Average payment terms - 30 days, average settlement period - 10 days.
The customer is paying their supplier 20 days early using checks. This presents two possible solutions:
- Moving the payments to card without changing payment timing allows the customer to earn rebates on the spend. It also ensures the supplier receives a more reliable digital payment.
- Moving the spend to card and adjusting the payment timing to the agreed payment terms of 30 days. The customer then retains their cash for an additional 20 days, improving their working capital and liquidity, while the supplier receives a more reliable digital payment.

In this example, our customer pays most of their displayed suppliers a few days earlier than the agreed payment terms. Yundt Group is the outlier, having to wait 64 days on average for payment with the agreed terms of 60 days. With payments to this supplier being consistently late, this presents an opportunity to discuss moving these payments to card.
Expenses
This section covers the customer's expenses (also known as direct costs) associated with the suppliers. Expenses are money that leave the business without impacting Accounts Payable, such as online purchases and out-of-pocket expenses.
- Definitions
- Recommended use
- Example data
| Column | Description | What it tells you |
|---|---|---|
| # of Expenses | Total count of positive ad hoc payments to the supplier in the reporting period. | A high count relative to bill count may indicate frequent ad hoc purchases outside the formal purchasing process. |
| Expenses amount | The total amount of all expenses for the supplier in base currency. | Significant expenses not captured as bills may represent an untapped card conversion opportunity. |
| Most recent direct cost | The date when the latest expense was incurred for the supplier. | Use to confirm the supplier relationship is still active. |
- Card conversion: suppliers with high expense totals may already accept card payments but aren't invoicing through the Accounts Payable process. This makes them strong candidates for virtual card outreach.
- Process gaps: tracking spend not captured in Accounts Payable is useful for compliance, rebate optimization, or spend policy enforcement.
- Audit and reconciliation: tracking of all supplier-related outflows, including expenses, ensures completeness of the spend analysis.

In our example, the customer has had 3 instances of expenses associated with Berge - Tillman totalling £177,071.27, with the most recent occurrence being in June 2025. Considering the most common payment method for this supplier is Undetermined, it's a good idea to check whether the supplier may be eligible for a card program.
Supplier details
The final section of this tab provides administrative details of each supplier, such as their ID in the customer's accounting software, their contact details, and tax information. This detail is pulled directly from the customer's accounting software and not manipulated.
The Supplier ID is an system-generated number assigned to a supplier record automatically when the record is first created in the customer's accounting software.
You can use supplier details as follows:
- Supplier contact details are ready to use for card enablement campaigns, KYC, or onboarding communications without needing to look up information elsewhere.
- Filter or group suppliers by region or tax status for targeted enablement or negotiation strategies.
- Spot missing tax numbers, incomplete contacts, or duplicate records that may affect compliance or reporting accuracy.
- Use tax and contact details in your organization's internal KYC processes.
Bills, Bill payments, Expenses
The Bills, Bill Payments, and Expenses tabs contain the raw transaction records pulled from the customer's accounting software and used to generate the report. You can use these to verify individual transactions, reconcile payments to bills, or trace summary figures back to source data.
| Tab | Key columns | Usage |
|---|---|---|
| Bills | Id, Supplier Id/Name, Total Amt, Issue Date, CompanyCompany In Codat, a company represents your customer's business entity. Companies can have multiple connections to different data sources. Id/Name | Auditing billed amounts, outstanding balances, and bill aging |
| Bill Payments | Id, Supplier Id/Name, Date, Currency, Currency Rate, Total Amt, Note | Reconciling payments to bills, analyzing payment timing, and validating settlement calculations |
| Expenses | Id, Contact Name/Id, Reference, Payment Account, Issue Date, Currency, Total Amt, Note | Tracing supplier spend not captured via bills |
For customers with a multi-entity organizational structure, these tabs include a Codat companyCompany In Codat, a company represents your customer's business entity. Companies can have multiple connections to different data sources. name and Codat companyCompany In Codat, a company represents your customer's business entity. Companies can have multiple connections to different data sources. ID column on each record. This helps to identify which entity each transaction belongs to.
Payment method determination
The report includes two columns that reflect the most common payment method associated with the supplier. The standard payment methods used in the report are Credit Card, Debit Card, Bank Transfer, Check, Cash, and Unknown.
They are determined independently either pulling the payment method value recorded in the customer's ERP or using Codat's payment method determination logic. This leads to the following outcomes:
- If the ERP field is inconsistently populated, the columns may differ.
- If the ERP field is always populated, both columns will usually match.
- If the ERP field is often missing, the inferred column gives a more complete picture.
Codat infers payment methods from the customer's accounting data using the following rules in order of priority:
| Priority | Source | How it's used |
|---|---|---|
| 1 | ERP payment method field | If populated, used directly and mapped to a standard category. |
| 2 | Account name | Scanned for keywords (e.g. "credit card", "Amex", "bank transfer", "check"). |
| 3 | Payment note or reference | Freetext field scanned for keywords. |
| 4 | Default value | If no match found, classified as Unknown. |